Nintendo’s profit/earnings chart 1981-2022
Putting #Nintendo's financials together.
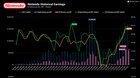
Here's a look at Nintendo's historical earnings from FY1981 – Present.
• FY2021 – Highest operating profit, ordinary profit, & operating profit ratio
• FY2009 – Highest net sales
• FY2001 – Highest ordinary profit ratio pic.twitter.com/GEoTXHsz4F
— Derek Strickland (@DeekeTweak) May 13, 2022