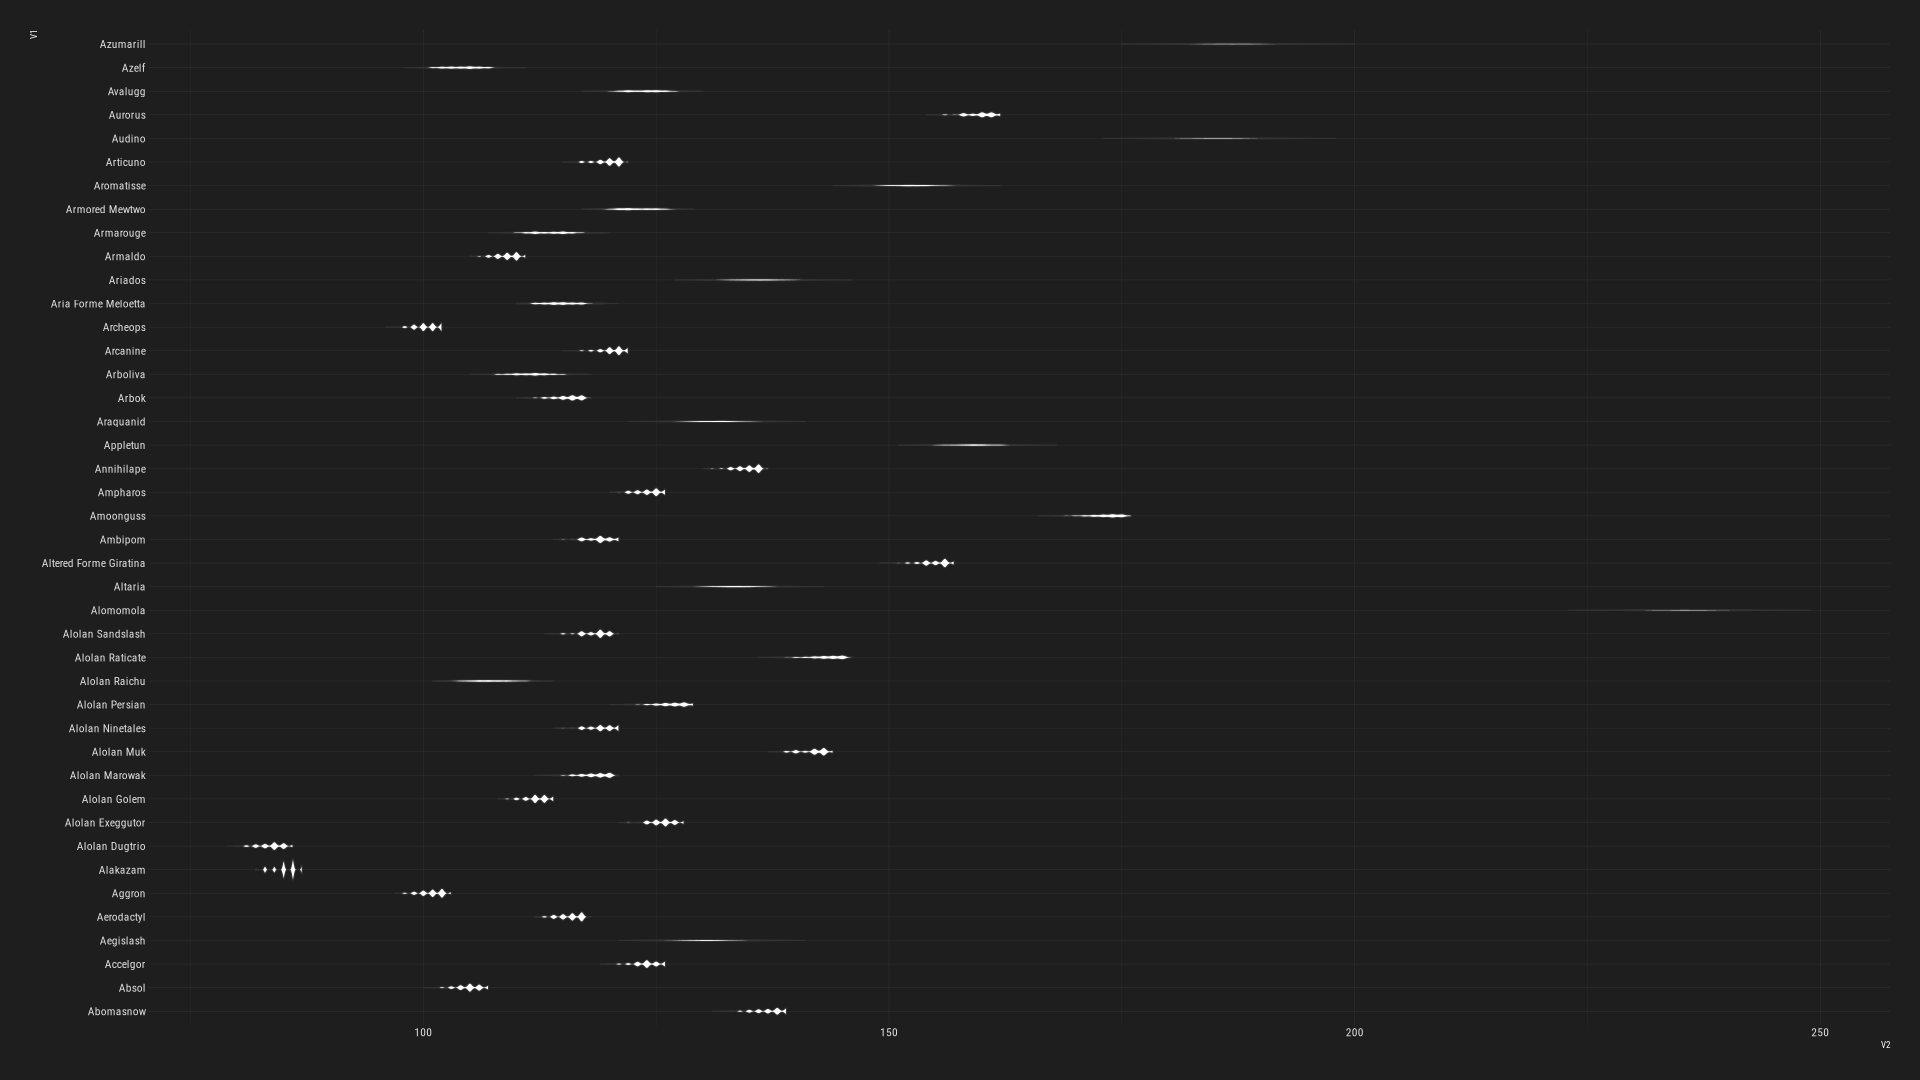
sorry for the kinda crappy appearance — i'm still learning to beat violin plots out of R, and this is actually my first attempt. i generated, for every form, under a CP bound of 1500, the 4096 configurations corresponding to every possible IV when raised to the highest level possible (subject to the bound). i then threw this into a violin plot. i expected that the higher the input stat product, the more stretched the distribution would be along the x axis, and the higher the ratio of STA to other stats, the further shifted along the x axis. that seems more or less borne out.
anyway, i'm going to work some more on visualizing this, and also check other stats. no deep analysis here and nothing new per se, but i'm looking forward to exploring these geometries further. happy friday!
for anyone looking to make similar graphs, this was generated via "ggplot(data, aes(x=V1, y = V2)) + geom_violin() + coord_flip() + scale_fill_viridis(discrete=TRUE) + scale_color_viridis(discrete=TRUE) + theme_modern_rc()" using R 4.5.1 as packaged on debian linux
by sosodank