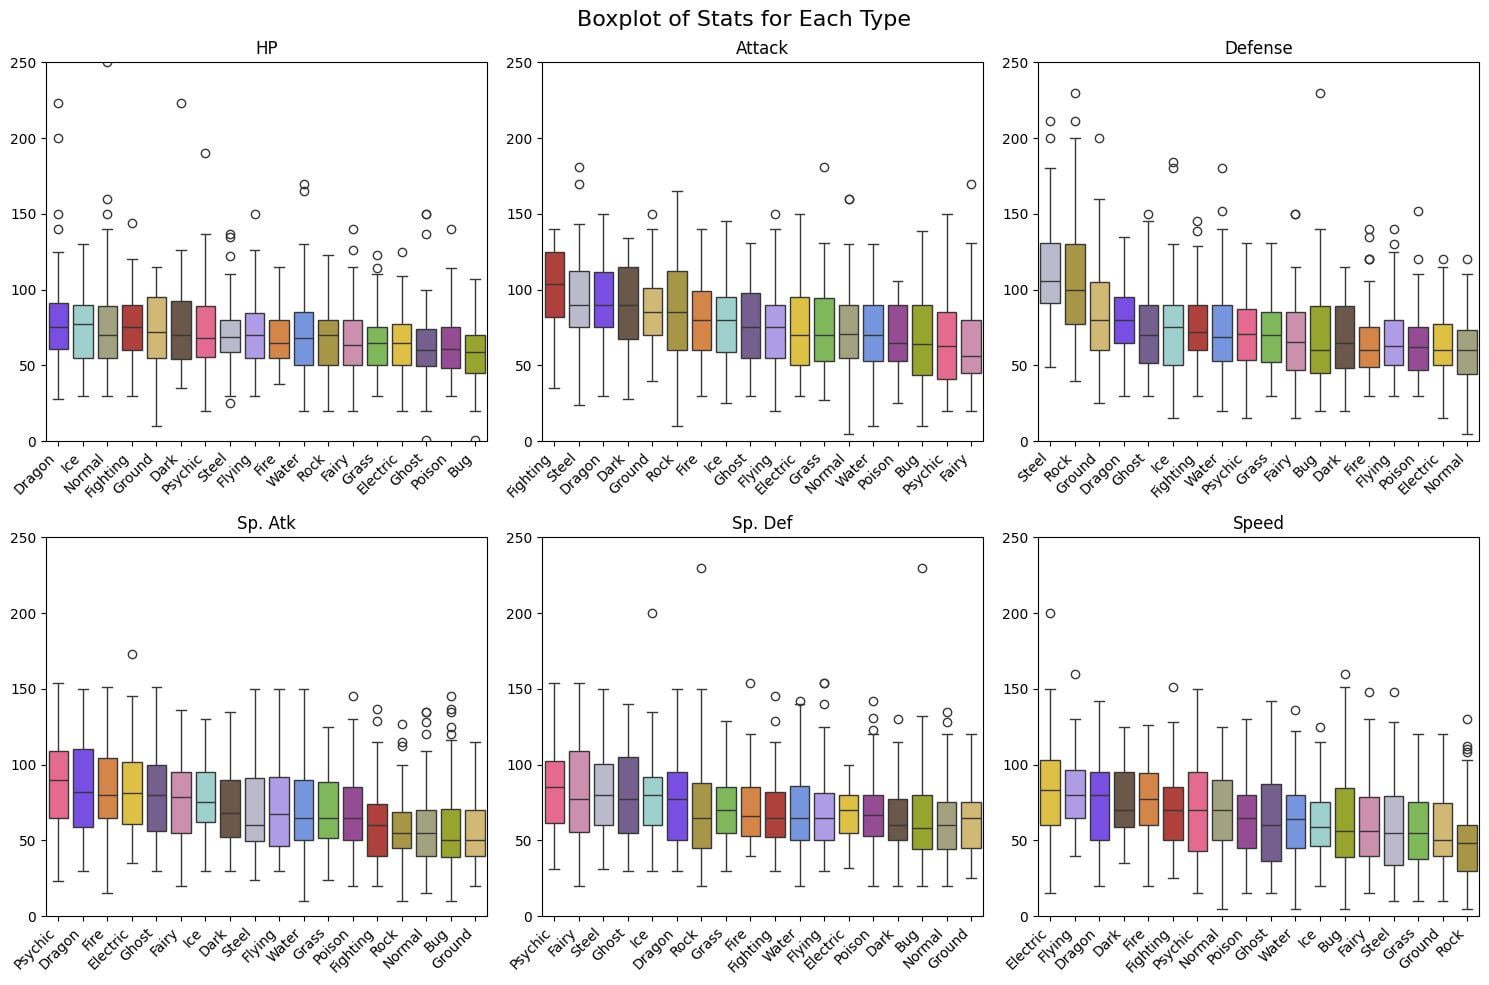
I think it's fun to visualise which pokemon types tend to come out on top and which types are lacking (Bug types… please… save my bug types :()
Lots of outliers, especially Chansey and Shedinja for HP.
It was just an excercise in data visualisation using python code, pandas and matplotlib. I'm no programmer. I did lots of back and forth with the dataset, took already existing code, etc…
It only counts pokemon up to Calyrex, as the dataset I used wasn't updated. So SV pokemon aren't present. If I gain access to an updated dataset (csv file), I could update this chart accordingly.
I mostly wanted to understand how to parse data, and visualise it in a way that is meaningful at all.
Anyways, just felt like sharing this on reddit.
by Graysbot